>
Technical note
3 Min read
Interface shear strength of geomembrane materials
Potential sources of failure of geosynthetic lined slopes are the interfaces of geosynthetic components, geosynthetic and the subgrade or a geosynthetic with the cover soil. Direct shear testing is often performed to determine this critical combination of loading and angle. The most common test performed to make this determination is ASTM D 5321. In order to make this test and the ensuing results meaningful, it is important that the testing be performed with site-specific interfaces (geosynthetics and soils) and site specific loading conditions.
Furthermore, the soil must be conditioned such that it is not only the same basic type but also that the compaction and the moisture content are the same as actual field conditions. The last component that must be selected is the shear rate. ASTM D 5321 stipulates default rate of 0.2 in/min for geosynthetic/geosynthetic interfaces and 0.04 in/min for geosynthetic/soil interfaces. Slower rates will give a better picture of the peak curve and will better simulate actual field conditions. However, the slower rates take longer to complete and are thus more costly to run.
The designer must weigh the importance of slope stability with the costs associated with a slower and potentially more accurate test. By specifying these site-specific conditions, the test becomes a more meaningful performance test rather than a standard index test1.
A typical direct shear test consists of a minimum of three tests run at three different normal pressures as shown in the figures below.
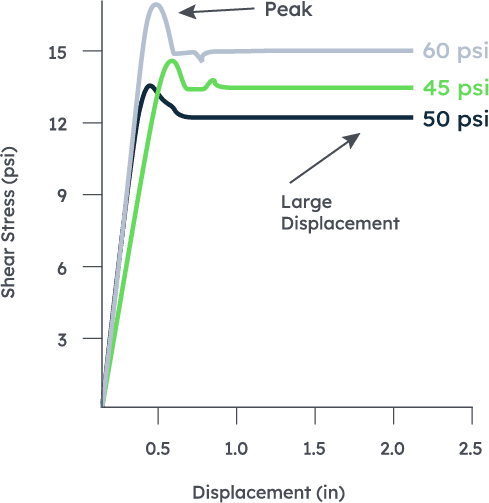
Figure 1
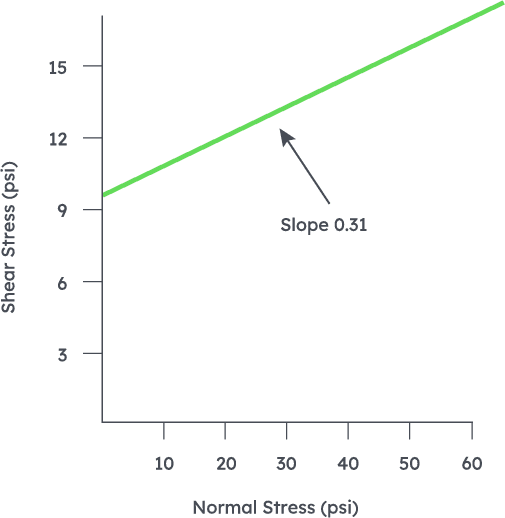
Figure 2
Figure 1 shows a plot of shear stress versus displacement. The lines begin to flatten out after the initial rise and fall. This area where the line becomes flat, that is, the stress required to shear the interface is constant, is the large displacement strength (residual). The peak stress corresponds to the peak friction angle.
Figure 2 shows a plot of peak shear stress versus normal stress. The friction angle is derived from the slope of this line. In the previous example, the slope is 0.31. The friction angle is thus tan-1 (0.31) = 17 degrees. A similar graph could be plotted showing large displacement stress versus normal stress. Determination of the slope of this line would give the large displacement friction angle.
Again, friction testing can be performed for a variety of interfaces, normal pressures and seat times. The materials can be run dry or, for worst case scenarios, can be run with saturated conditions. No manufacturer can guarantee a specific friction angle for a given set of site specific conditions. Testing must be performed to ensuret hat the particular interfaces will meet the needs for the particular application. That being said, the tables below list representative results from tests that have been performed on various materials. These values are intended as a guide only, not a guarantee.
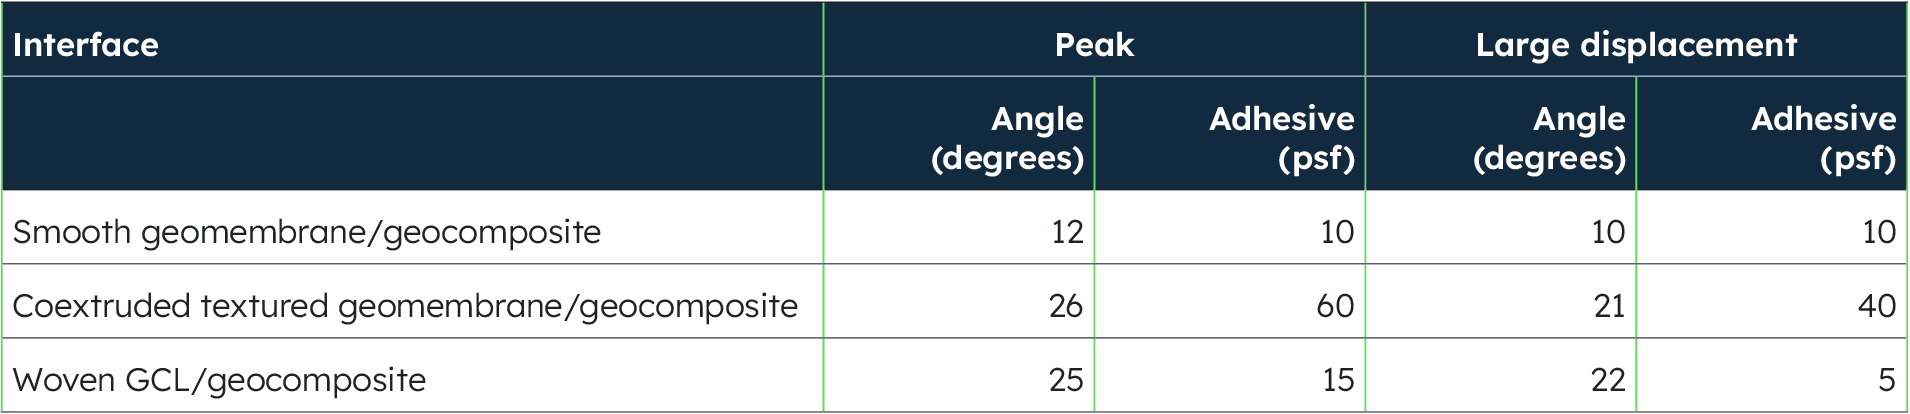
Table 1: Geosynthetic vs. geosynthetic normal stress 50, 400, 800 psf
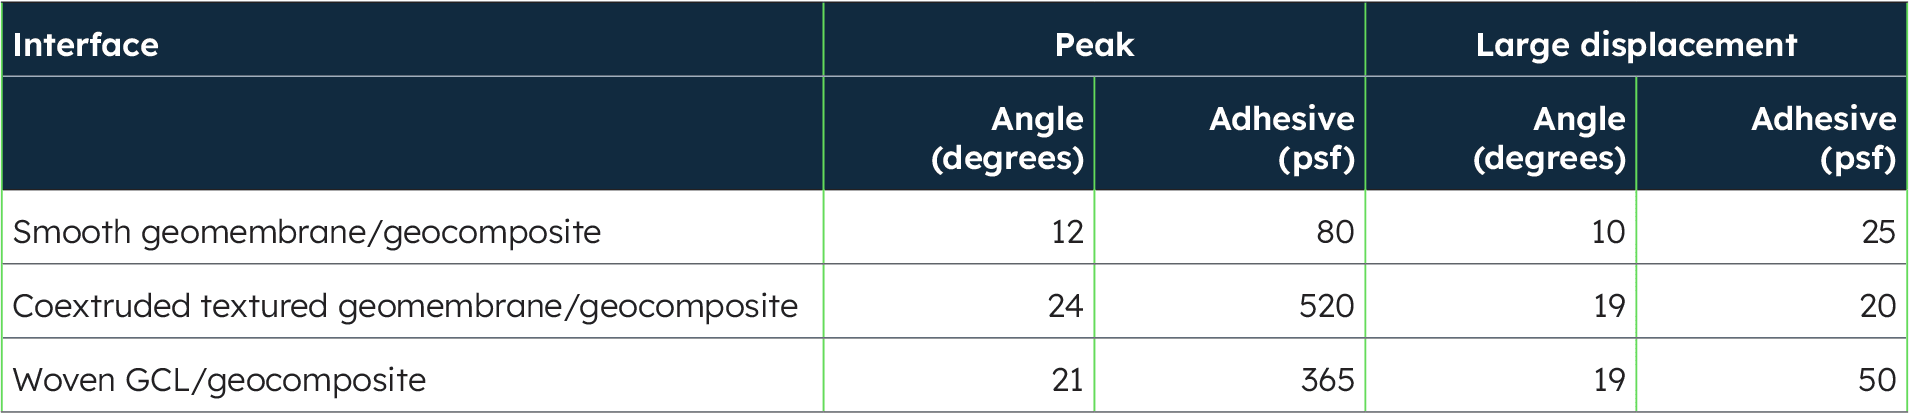
Table 2: Geosynthetic vs. geosynthetic normal stress 4000, 8000, 15000 psf
References
1 Solmax technical note - Index testing vs.performance testing